

Income inequality

 12-07-2011, 07:34 AM
#2
Libertarian Resistance
Thread Starter
Joined APC: Feb 2007
Position: 757 FO
Posts: 1,057
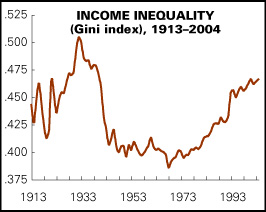
Reference the chart in the previous post.
Much has been made of the rise of income inequality as measured by that GINI index. Most of the discussion seems to consider this a problem, and to blame the problem on wealthy capitalists. Rent seeking crony-capitalists always prosper at the big gov't trough.
But I am interested in knowing if anyone is aware of research or commentary that explores other factors that may have contributed to the rise of income inequality since 1968.
For example, our endless war on drugs incarcerates legions of (mostly) men who are (mostly) at the entry level of the economy. What effect does this have on GINI?
Divorce divides families economically and prevents wealth creation--how have divorce rates affected the GINI index since the 1960s?
Great Society programs, especially those that subsidized single motherhood.
HEW was elevated to cabinet status in the mid-1950s. What effect here?
While I suspect that all of the things i have mentioned have made income inequality worse, that is just a supposition. Any other takes on this?
WW
12-08-2011, 09:00 AM
#3
With The Resistance
Joined APC: Jan 2006
Position: Burning the Agitprop of the Apparat
Posts: 6,191
Any single measure used to state the good/bad in an economy is going to have a lot of faults, it takes a lot of measurements to come to a reasonable conclusion.
--------------------------------------------------------------
Disadvantages of Gini coefficient as a measure of inequalityThe limitations of Gini largely lie in its relative nature: It loses information about absolute national and personal incomes. Countries may have identical Gini coefficients, but differ greatly in wealth. Basic necessities may be equal (available to all) in a rich country, while in the poor country, even basic necessities are unequally available.
By measuring inequality in income, the Gini ignores the differential efficiency of use of household income. By ignoring wealth (except as it contributes to income) the Gini can create the appearance of inequality when the people compared are at different stages in their life. Wealthy countries (e.g. Sweden) can appear more equal, yet have high Gini coefficients for wealth (for instance 77% of the share value owned by households is held by just 5% of Swedish shareholding households).[13][dead link] These factors are not assessed in income-based Gini.
Gini has some mathematical limitations as well. For instance, different sets of people cannot be averaged to obtain the Gini coefficient of all the people in the sets: if a Gini coefficient were to be calculated for each person it would always be zero. For a large, economically diverse country, a much higher coefficient will be calculated for the country as a whole than will be calculated for each of its regions. (The coefficient is usually applied to measurable nominal income rather than local purchasing power, tending to increase the calculated coefficient across larger areas.)
As is the case for any single measure of a distribution, economies with similar incomes and Gini coefficients can still have very different income distributions. This results from differing shapes of the Lorenz curve. For example, consider a society where half of individuals had no income and the other half shared all the income equally (i.e. whose Lorenz curve is linear from (0,0) to (0.5,0) and then linear to (1,1)). As is easily calculated, this society has Gini coefficient 0.5 -- the same as that of a society in which 75% of people equally shared 25% of income while the remaining 25% equally shared 75% (i.e. whose Lorenz curve is linear from (0,0) to (0.75,0.25) and then linear to (1,1)).
Too often only the Gini coefficient is quoted without describing the proportions of the quantiles used for measurement. As with other inequality coefficients, the Gini coefficient is influenced by the granularity of the measurements. For example, five 20% quantiles (low granularity) will usually yield a lower Gini coefficient than twenty 5% quantiles (high granularity) taken from the same distribution. This is an often encountered problem with measurements.
Care should be taken in using the Gini coefficient as a measure of egalitarianism, as it is properly a measure of income dispersion. For example, if two equally egalitarian countries pursue different immigration policies, the country accepting a higher proportion of low-income or impoverished migrants will be assessed as less equal (gain a higher Gini coefficient).
Expanding on the importance of life-span measures, the Gini coefficient as a point-estimate of equality at a certain time, ignores life-span changes in income. Typically, increases in the proportion of young or old members of a society will drive apparent changes in equality, simply because people generally have lower incomes and wealth when they are young than when they are old. Because of this, factors such as age distribution within a population and mobility within income classes can create the appearance of differential equality when none exist taking into account demographic effects. Thus a given economy may have a higher Gini coefficient at any one point in time compared to another, while the Gini coefficient calculated over individuals' lifetime income is actually lower than the apparently more equal (at a given point in time) economy's.[14] Essentially, what matters is not just inequality in any particular year, but the composition of the distribution over time.
[edit] General problems of measurementComparing income distributions among countries may be difficult because benefits systems may differ. For example, some countries give benefits in the form of money while others give food stamps, which might not be counted by some economists and researchers as income in the Lorenz curve and therefore not taken into account in the Gini coefficient. The Soviet Union was measured to have relatively high income inequality: by some estimates, in the late 1970s, Gini coefficient of its urban population was as high as 0.38,[15] which is higher than many Western countries today. This number would not reflect those benefits received by Soviet citizens that were not monetized for measurement, which may include child care for children as young as two months, elementary, secondary and higher education, cradle-to-grave medical care, and heavily subsidized or provided housing. In this example, a more accurate comparison between the 1970s Soviet Union and Western countries may require one to assign monetary values to all benefits – a difficult task in the absence of free markets. Similar problems arise whenever a comparison between more liberalized economies and partially socialist economies is attempted. Benefits may take various and unexpected forms: for example, major oil producers such as Venezuela and Iran provide indirect benefits to its citizens by subsidizing the retail price of gasoline.
Similarly, in some societies people may have significant income in other forms than money, for example through subsistence farming or bartering. Like non-monetary benefits, the value of these incomes is difficult to quantify. Different quantifications of these incomes will yield different Gini coefficients.
The measure will give different results when applied to individuals instead of households. When different populations are not measured with consistent definitions, comparison is not meaningful.
As for all statistics, there may be systematic and random errors in the data. The meaning of the Gini coefficient decreases as the data become less accurate. Also, countries may collect data differently, making it difficult to compare statistics between countries.
As one result of this criticism, in addition to or in competition with the Gini coefficient entropy measures are frequently used (e.g. the Theil Index and the Atkinson index). These measures attempt to compare the distribution of resources by intelligent agents in the market with a maximum entropy random distribution, which would occur if these agents acted like non-intelligent particles in a closed system following the laws of statistical physics.
[edit] Credit riskThe Gini coefficient is also commonly used for the measurement of the discriminatory power of rating systems in credit risk management.
The discriminatory power refers to a credit risk model's ability to differentiate between defaulting and non-defaulting clients. The above formula G1 may be used for the final model and also at individual model factor level, to quantify the discriminatory power of individual factors. This is as a result of too many non defaulting clients falling into the lower points scale e.g. factor has a 10 point scale and 30% of non defaulting clients are being assigned the lowest points available e.g. 0 or negative points. This indicates that the factor is behaving in a counter-intuitive manner and would require further investigation at the model development stage.[16]
12-08-2011, 10:38 AM
#4
Gets Weekends Off
Joined APC: Mar 2006
Position: FO - 757/767
Posts: 1,228
Although this will probably be deleted before I strike the submit key, and an infraction is already in my mailbox, I'm gonna say it anyway.
Mind you, this is not a racists comment: illegal immigrants are contributing to the inequality of wealth. By working for sub-standard wages, they are creating their own lower class while fattening up the wallets of business owners saving on labor costs. Wanna know what happend to the middle class? They've been outbid. Oh sure, you can say that illegals only do "jobs that other americans won't do". Hogwash! Take the lawn cutting business; it could be a good union job and help put cash into american families' pockets. But non-union workers, that should not be here in the first place, have worked for much less. I could go on, but I think I'm writing what most (with a brain) already know. Btw, I am pro-immigration. LEGAL immigration.
Mind you, this is not a racists comment: illegal immigrants are contributing to the inequality of wealth. By working for sub-standard wages, they are creating their own lower class while fattening up the wallets of business owners saving on labor costs. Wanna know what happend to the middle class? They've been outbid. Oh sure, you can say that illegals only do "jobs that other americans won't do". Hogwash! Take the lawn cutting business; it could be a good union job and help put cash into american families' pockets. But non-union workers, that should not be here in the first place, have worked for much less. I could go on, but I think I'm writing what most (with a brain) already know. Btw, I am pro-immigration. LEGAL immigration.
12-09-2011, 05:39 AM
#5
Libertarian Resistance
Thread Starter
Joined APC: Feb 2007
Position: 757 FO
Posts: 1,057
Originally Posted by jungle

Any single measure used to state the good/bad in an economy is going to have a lot of faults, it takes a lot of measurements to come to a reasonable conclusion.
--------------------------------------------------------------
Disadvantages of Gini coefficient as a measure of inequalityThe limitations of Gini largely lie in its relative nature: It loses information about absolute national and personal incomes. Countries may have identical Gini coefficients, but differ greatly in wealth. Basic necessities may be equal (available to all) in a rich country, while in the poor country, even basic necessities are unequally available.
By measuring inequality in income, the Gini ignores the differential efficiency of use of household income. By ignoring wealth (except as it contributes to income) the Gini can create the appearance of inequality when the people compared are at different stages in their life. Wealthy countries (e.g. Sweden) can appear more equal, yet have high Gini coefficients for wealth (for instance 77% of the share value owned by households is held by just 5% of Swedish shareholding households).[13][dead link] These factors are not assessed in income-based Gini.
Gini has some mathematical limitations as well. For instance, different sets of people cannot be averaged to obtain the Gini coefficient of all the people in the sets: if a Gini coefficient were to be calculated for each person it would always be zero. For a large, economically diverse country, a much higher coefficient will be calculated for the country as a whole than will be calculated for each of its regions. (The coefficient is usually applied to measurable nominal income rather than local purchasing power, tending to increase the calculated coefficient across larger areas.)
As is the case for any single measure of a distribution, economies with similar incomes and Gini coefficients can still have very different income distributions. This results from differing shapes of the Lorenz curve. For example, consider a society where half of individuals had no income and the other half shared all the income equally (i.e. whose Lorenz curve is linear from (0,0) to (0.5,0) and then linear to (1,1)). As is easily calculated, this society has Gini coefficient 0.5 -- the same as that of a society in which 75% of people equally shared 25% of income while the remaining 25% equally shared 75% (i.e. whose Lorenz curve is linear from (0,0) to (0.75,0.25) and then linear to (1,1)).
Too often only the Gini coefficient is quoted without describing the proportions of the quantiles used for measurement. As with other inequality coefficients, the Gini coefficient is influenced by the granularity of the measurements. For example, five 20% quantiles (low granularity) will usually yield a lower Gini coefficient than twenty 5% quantiles (high granularity) taken from the same distribution. This is an often encountered problem with measurements.
Care should be taken in using the Gini coefficient as a measure of egalitarianism, as it is properly a measure of income dispersion. For example, if two equally egalitarian countries pursue different immigration policies, the country accepting a higher proportion of low-income or impoverished migrants will be assessed as less equal (gain a higher Gini coefficient).
Expanding on the importance of life-span measures, the Gini coefficient as a point-estimate of equality at a certain time, ignores life-span changes in income. Typically, increases in the proportion of young or old members of a society will drive apparent changes in equality, simply because people generally have lower incomes and wealth when they are young than when they are old. Because of this, factors such as age distribution within a population and mobility within income classes can create the appearance of differential equality when none exist taking into account demographic effects. Thus a given economy may have a higher Gini coefficient at any one point in time compared to another, while the Gini coefficient calculated over individuals' lifetime income is actually lower than the apparently more equal (at a given point in time) economy's.[14] Essentially, what matters is not just inequality in any particular year, but the composition of the distribution over time.
[edit] General problems of measurementComparing income distributions among countries may be difficult because benefits systems may differ. For example, some countries give benefits in the form of money while others give food stamps, which might not be counted by some economists and researchers as income in the Lorenz curve and therefore not taken into account in the Gini coefficient. The Soviet Union was measured to have relatively high income inequality: by some estimates, in the late 1970s, Gini coefficient of its urban population was as high as 0.38,[15] which is higher than many Western countries today. This number would not reflect those benefits received by Soviet citizens that were not monetized for measurement, which may include child care for children as young as two months, elementary, secondary and higher education, cradle-to-grave medical care, and heavily subsidized or provided housing. In this example, a more accurate comparison between the 1970s Soviet Union and Western countries may require one to assign monetary values to all benefits – a difficult task in the absence of free markets. Similar problems arise whenever a comparison between more liberalized economies and partially socialist economies is attempted. Benefits may take various and unexpected forms: for example, major oil producers such as Venezuela and Iran provide indirect benefits to its citizens by subsidizing the retail price of gasoline.
Similarly, in some societies people may have significant income in other forms than money, for example through subsistence farming or bartering. Like non-monetary benefits, the value of these incomes is difficult to quantify. Different quantifications of these incomes will yield different Gini coefficients.
The measure will give different results when applied to individuals instead of households. When different populations are not measured with consistent definitions, comparison is not meaningful.
As for all statistics, there may be systematic and random errors in the data. The meaning of the Gini coefficient decreases as the data become less accurate. Also, countries may collect data differently, making it difficult to compare statistics between countries.
As one result of this criticism, in addition to or in competition with the Gini coefficient entropy measures are frequently used (e.g. the Theil Index and the Atkinson index). These measures attempt to compare the distribution of resources by intelligent agents in the market with a maximum entropy random distribution, which would occur if these agents acted like non-intelligent particles in a closed system following the laws of statistical physics.
[edit] Credit riskThe Gini coefficient is also commonly used for the measurement of the discriminatory power of rating systems in credit risk management.
The discriminatory power refers to a credit risk model's ability to differentiate between defaulting and non-defaulting clients. The above formula G1 may be used for the final model and also at individual model factor level, to quantify the discriminatory power of individual factors. This is as a result of too many non defaulting clients falling into the lower points scale e.g. factor has a 10 point scale and 30% of non defaulting clients are being assigned the lowest points available e.g. 0 or negative points. This indicates that the factor is behaving in a counter-intuitive manner and would require further investigation at the model development stage.[16]
--------------------------------------------------------------
Disadvantages of Gini coefficient as a measure of inequalityThe limitations of Gini largely lie in its relative nature: It loses information about absolute national and personal incomes. Countries may have identical Gini coefficients, but differ greatly in wealth. Basic necessities may be equal (available to all) in a rich country, while in the poor country, even basic necessities are unequally available.
By measuring inequality in income, the Gini ignores the differential efficiency of use of household income. By ignoring wealth (except as it contributes to income) the Gini can create the appearance of inequality when the people compared are at different stages in their life. Wealthy countries (e.g. Sweden) can appear more equal, yet have high Gini coefficients for wealth (for instance 77% of the share value owned by households is held by just 5% of Swedish shareholding households).[13][dead link] These factors are not assessed in income-based Gini.
Gini has some mathematical limitations as well. For instance, different sets of people cannot be averaged to obtain the Gini coefficient of all the people in the sets: if a Gini coefficient were to be calculated for each person it would always be zero. For a large, economically diverse country, a much higher coefficient will be calculated for the country as a whole than will be calculated for each of its regions. (The coefficient is usually applied to measurable nominal income rather than local purchasing power, tending to increase the calculated coefficient across larger areas.)
As is the case for any single measure of a distribution, economies with similar incomes and Gini coefficients can still have very different income distributions. This results from differing shapes of the Lorenz curve. For example, consider a society where half of individuals had no income and the other half shared all the income equally (i.e. whose Lorenz curve is linear from (0,0) to (0.5,0) and then linear to (1,1)). As is easily calculated, this society has Gini coefficient 0.5 -- the same as that of a society in which 75% of people equally shared 25% of income while the remaining 25% equally shared 75% (i.e. whose Lorenz curve is linear from (0,0) to (0.75,0.25) and then linear to (1,1)).
Too often only the Gini coefficient is quoted without describing the proportions of the quantiles used for measurement. As with other inequality coefficients, the Gini coefficient is influenced by the granularity of the measurements. For example, five 20% quantiles (low granularity) will usually yield a lower Gini coefficient than twenty 5% quantiles (high granularity) taken from the same distribution. This is an often encountered problem with measurements.
Care should be taken in using the Gini coefficient as a measure of egalitarianism, as it is properly a measure of income dispersion. For example, if two equally egalitarian countries pursue different immigration policies, the country accepting a higher proportion of low-income or impoverished migrants will be assessed as less equal (gain a higher Gini coefficient).
Expanding on the importance of life-span measures, the Gini coefficient as a point-estimate of equality at a certain time, ignores life-span changes in income. Typically, increases in the proportion of young or old members of a society will drive apparent changes in equality, simply because people generally have lower incomes and wealth when they are young than when they are old. Because of this, factors such as age distribution within a population and mobility within income classes can create the appearance of differential equality when none exist taking into account demographic effects. Thus a given economy may have a higher Gini coefficient at any one point in time compared to another, while the Gini coefficient calculated over individuals' lifetime income is actually lower than the apparently more equal (at a given point in time) economy's.[14] Essentially, what matters is not just inequality in any particular year, but the composition of the distribution over time.
[edit] General problems of measurementComparing income distributions among countries may be difficult because benefits systems may differ. For example, some countries give benefits in the form of money while others give food stamps, which might not be counted by some economists and researchers as income in the Lorenz curve and therefore not taken into account in the Gini coefficient. The Soviet Union was measured to have relatively high income inequality: by some estimates, in the late 1970s, Gini coefficient of its urban population was as high as 0.38,[15] which is higher than many Western countries today. This number would not reflect those benefits received by Soviet citizens that were not monetized for measurement, which may include child care for children as young as two months, elementary, secondary and higher education, cradle-to-grave medical care, and heavily subsidized or provided housing. In this example, a more accurate comparison between the 1970s Soviet Union and Western countries may require one to assign monetary values to all benefits – a difficult task in the absence of free markets. Similar problems arise whenever a comparison between more liberalized economies and partially socialist economies is attempted. Benefits may take various and unexpected forms: for example, major oil producers such as Venezuela and Iran provide indirect benefits to its citizens by subsidizing the retail price of gasoline.
Similarly, in some societies people may have significant income in other forms than money, for example through subsistence farming or bartering. Like non-monetary benefits, the value of these incomes is difficult to quantify. Different quantifications of these incomes will yield different Gini coefficients.
The measure will give different results when applied to individuals instead of households. When different populations are not measured with consistent definitions, comparison is not meaningful.
As for all statistics, there may be systematic and random errors in the data. The meaning of the Gini coefficient decreases as the data become less accurate. Also, countries may collect data differently, making it difficult to compare statistics between countries.
As one result of this criticism, in addition to or in competition with the Gini coefficient entropy measures are frequently used (e.g. the Theil Index and the Atkinson index). These measures attempt to compare the distribution of resources by intelligent agents in the market with a maximum entropy random distribution, which would occur if these agents acted like non-intelligent particles in a closed system following the laws of statistical physics.
[edit] Credit riskThe Gini coefficient is also commonly used for the measurement of the discriminatory power of rating systems in credit risk management.
The discriminatory power refers to a credit risk model's ability to differentiate between defaulting and non-defaulting clients. The above formula G1 may be used for the final model and also at individual model factor level, to quantify the discriminatory power of individual factors. This is as a result of too many non defaulting clients falling into the lower points scale e.g. factor has a 10 point scale and 30% of non defaulting clients are being assigned the lowest points available e.g. 0 or negative points. This indicates that the factor is behaving in a counter-intuitive manner and would require further investigation at the model development stage.[16]
I considered discussing the value of the GINI in the OP. I'm not sold on the fact that these values are consistant across economies. I am also not sold on the idea that rising income inequality (however it is measured) is necessarily a problem.
Good info you've posted here.
WW
12-09-2011, 05:47 AM
#6
Libertarian Resistance
Thread Starter
Joined APC: Feb 2007
Position: 757 FO
Posts: 1,057
Originally Posted by HotMamaPilot
Although this will probably be deleted before I strike the submit key, and an infraction is already in my mailbox, I'm gonna say it anyway.
Mind you, this is not a racists comment: illegal immigrants are contributing to the inequality of wealth. By working for sub-standard wages, they are creating their own lower class while fattening up the wallets of business owners saving on labor costs. Wanna know what happend to the middle class? They've been outbid. Oh sure, you can say that illegals only do "jobs that other americans won't do". Hogwash! Take the lawn cutting business; it could be a good union job and help put cash into american families' pockets. But non-union workers, that should not be here in the first place, have worked for much less. I could go on, but I think I'm writing what most (with a brain) already know. Btw, I am pro-immigration. LEGAL immigration.
Mind you, this is not a racists comment: illegal immigrants are contributing to the inequality of wealth. By working for sub-standard wages, they are creating their own lower class while fattening up the wallets of business owners saving on labor costs. Wanna know what happend to the middle class? They've been outbid. Oh sure, you can say that illegals only do "jobs that other americans won't do". Hogwash! Take the lawn cutting business; it could be a good union job and help put cash into american families' pockets. But non-union workers, that should not be here in the first place, have worked for much less. I could go on, but I think I'm writing what most (with a brain) already know. Btw, I am pro-immigration. LEGAL immigration.
HMP,
Interesting point on immigration. We'd have to compare it to immigration in the first part of the 20th century. I think that round of immigration was smaller in absolute numbers than the recent immigration, but may have been bigger as a % of US population. I am pretty sure it ended almost totally at the onset of WW1.
Good point.
WW
12-09-2011, 06:05 AM
#7
Gets Weekends Off
Joined APC: Aug 2010
Position: 747 CA
Posts: 344
Originally Posted by HotMamaPilot
Mind you, this is not a racists comment: illegal immigrants are contributing to the inequality of wealth. By working for sub-standard wages, they are creating their own lower class while fattening up the wallets of business owners saving on labor costs.
12-20-2011, 03:53 AM
#8
Retired
Joined APC: Feb 2008
Position: whale wrangler
Posts: 3,527
Originally Posted by HotMamaPilot
Although this will probably be deleted before I strike the submit key, and an infraction is already in my mailbox, I'm gonna say it anyway.
Mind you, this is not a racists comment: illegal immigrants are contributing to the inequality of wealth. By working for sub-standard wages, they are creating their own lower class while fattening up the wallets of business owners saving on labor costs. Wanna know what happend to the middle class? They've been outbid. Oh sure, you can say that illegals only do "jobs that other americans won't do". Hogwash! Take the lawn cutting business; it could be a good union job and help put cash into american families' pockets. But non-union workers, that should not be here in the first place, have worked for much less. I could go on, but I think I'm writing what most (with a brain) already know. Btw, I am pro-immigration. LEGAL immigration.
Mind you, this is not a racists comment: illegal immigrants are contributing to the inequality of wealth. By working for sub-standard wages, they are creating their own lower class while fattening up the wallets of business owners saving on labor costs. Wanna know what happend to the middle class? They've been outbid. Oh sure, you can say that illegals only do "jobs that other americans won't do". Hogwash! Take the lawn cutting business; it could be a good union job and help put cash into american families' pockets. But non-union workers, that should not be here in the first place, have worked for much less. I could go on, but I think I'm writing what most (with a brain) already know. Btw, I am pro-immigration. LEGAL immigration.
What are your thoughts in regards to the massive amounts of wealth redistribution from this country to Communist China ?
12-21-2011, 06:59 AM
#9
Retired
Joined APC: Feb 2008
Position: whale wrangler
Posts: 3,527
Originally Posted by DYNASTY HVY
What are your thoughts in regards to the massive amounts of wealth redistribution from this country to Communist China ?
 12-22-2011, 05:13 AM
#10
Bracing for Fallacies
Joined APC: Jul 2007
Position: In favor of good things, not in favor of bad things
Posts: 3,543
Originally Posted by DYNASTY HVY
While we're waiting for a reply does anyone else have any thoughts on this ?

Thread
Thread Starter
Forum
Replies
Last Post


