Originally Posted by
FangsF15
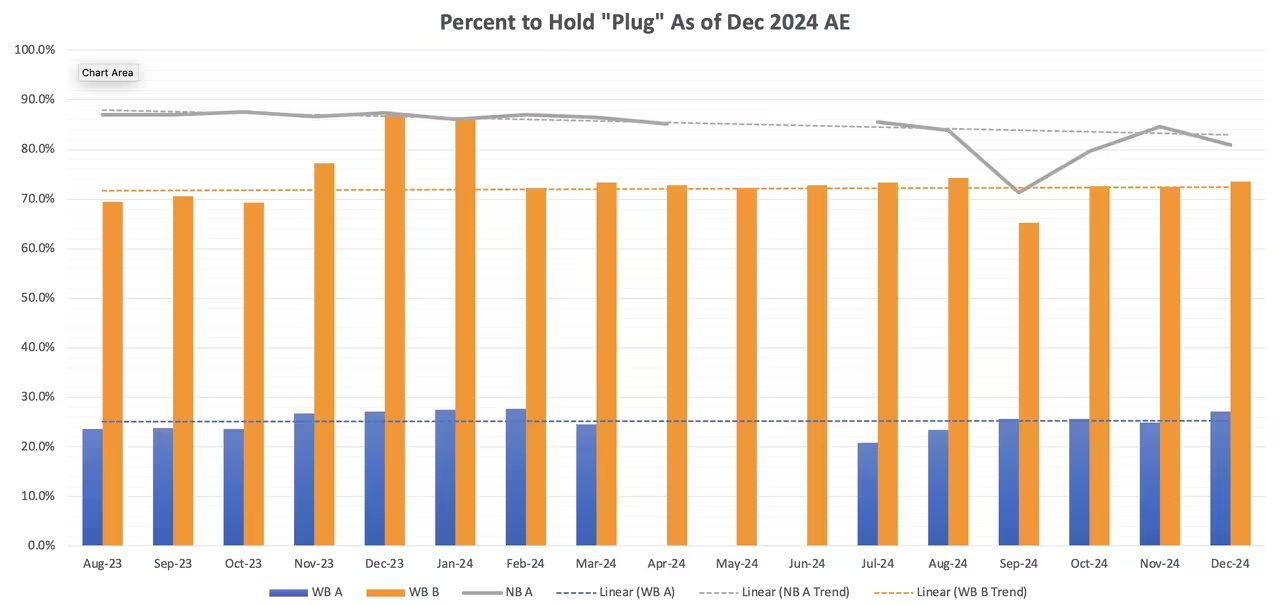
Dec AE
WB A 46xx, 27.2%
WB B 12,6xx, 73.6%
NB A 139xx, 80.9%
BOS 330 A 27xx 16.0%
BOS 330 B 139xx 73.6%
Very slightly more junior WB (A and B), and more senior NB Captain bids. NB A seems to be on a distictly more senior trend, which as hiring slows to a normal pace (or less?), will drive the time to hold Captain notably longer. Prosepective NH's take note. Despite saying they likely woudn't fill all BOS spots, there were actually a few BOS backfills for the first time (I think), as some folks bid out via base change, and one first time captain. That said, I took BOS out of the chart, since it seems to be pretty stable now (2 bids now, where the junior WB B awarded was BOS 330 B), and it feels like a distraction. I also had excel add sub-10% grid lines to be able to see smaller trends. As always, happy to have any feedback.
This is totally pedantic and absolutely dick, but my only suggestion would be to stop hovering your cursor over the graphs when you screenshot them (Chart Area pop-up in top left).
I'll give you my employee number so you know who to avoid in future pairings.