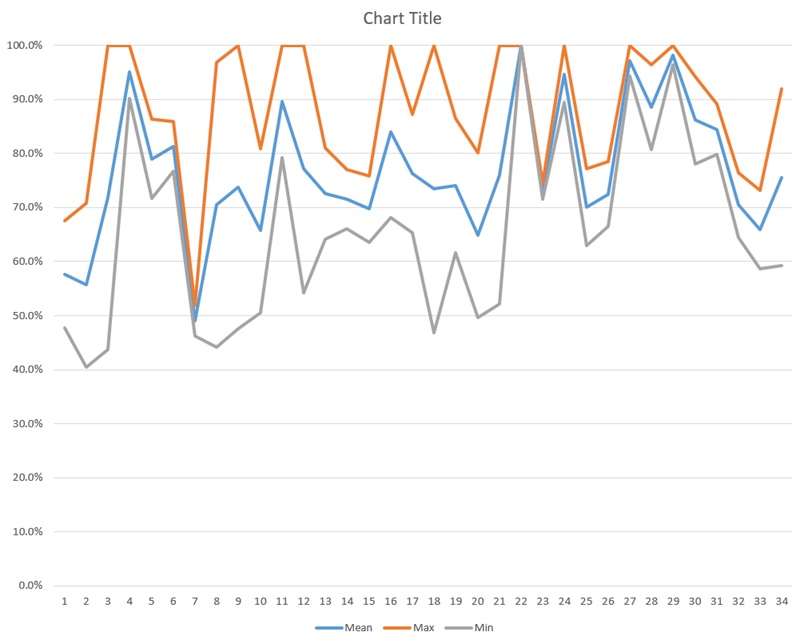
Just to follow on my previous post, here's a recent graph I had made tracking coverage awards for the ATL717B category over a roughly 2.5 year period. It's a few months out of date.
This particular chart doesn't break out RES vs REG. What it does do is show the % seniority it took to completely avoid coverage regardless of RES/REG (the orange line), and how deep the coverage might go if you were committed to either RES or REG (the Grey line.)
The Blue line represents the mean (average) between those 2. This blue line is where I get my idea that below 70% "mostly" avoids coverage for a flexible bidder (willing to get either REG or RES to hold days off), and below 50% virtually guarantees that same bidder to ALWAYS get the days off they want.
YCMV (Your category may vary.)