Originally Posted by
Pineapple Guy
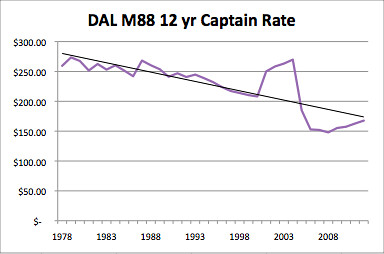
Here's a chart showing inflation adjusted, DAL M88 hourly rates for 12-yr Captain (727 rates used prior to 1985). This chart verifies my previous statement that this career has been on a 30 year down trendline since deregulation. C2K was a single aberration above that trendline, and BK was a single aberration below that trendline. By 2012, we are back to the trendline.
We need to figure out how to reverse course, but to blame this on one person, or one entity is simple minded and not reality.
Good graph PG. I'll agree with you 100% that no one individual or entity can be blamed here. It took 30 years to slide to where we are at, and it will take a few years if not a decade to get the trend line headed in the right direction. I wonder what a graph that included benefits and retirement value would look like since 1978?